Discovering Polymers Through Visual Experiences
- Abt 1,2,*, N. Candau 1,2
1eb-POLICOM – e-PLASCOM, Department of Materials Science and Engineering, Barcelona-Tech, Campus Diagonal Besòs-EEBE, Universitat Politècnica de Catalunya – Barcelona, 08019, Spain
2Center for Research in Multiscale Science and Engineering of Barcelona, Barcelona-Tech, Campus Diagonal Besòs-EEBE, Universitat Politècnica de Catalunya – Barcelona, 08019, Spain
*Corresponding author: tobias.abt@upc.edu
Key Points:
- Hands-on polymer science made accessible: Low-cost, DIY experiments (like tensile testing with everyday materials) successfully demonstrate key concepts such as stress–strain behavior, Young’s modulus, and yield strength—making polymer mechanics tangible for students.
- Complex concepts brought to life through multisensory learning: Visual and interactive demonstrations of phenomena like the glass transition and elastocaloric effect help learners see, feel, and experience polymer behavior in real time.
- Proven educational impact: The approach delivers reproducible, meaningful results and significantly boosts student engagement, helping bridge the gap between theoretical polymer science and real-world understanding.
Abstract:
Polymeric materials are present in almost every aspect of our modern lives: packaging, textiles, household appliances, automobiles, electronic components, medical prostheses, and much more. However, the science behind their mechanical and thermal behaviour is complex and not usually accessible to the public or pre-university students. Within the framework of the e-PLASCOM research group at the Polytechnic University of Catalonia, we have designed a series of outreach activities for high school students, aiming to introduce fundamental concepts of polymer physics through visual and participatory activities. These activities have been carried out during open campus days, Science Week, and the Escolab program. The multisensory approach allows learning to take place through sight, touch, hearing, and even smell, transforming complex phenomena such as the glass transition or the thermodynamics of elastomers into concrete and memorable experiences. Three of these illustrative experiences, namely the mechanical properties, the glass transition and the elastocaloric effect of elastomers are presented below.
1. Introduction
Polymers are present in numerous everyday objects, but their fundamental properties are little known to the public. To make these concepts accessible, we propose a series of experimental activities for secondary school students (ages 12–18), which can be carried out without the need of expensive machines or equipments. Through visual and participatory demonstrations, key phenomena of polymer behaviour are explored. The concept of some important mechanical properties such as the yield strength is introduced and visualized through a series of tensile tests. For this purpose, we present a low-cost, Do-It-Yourself experimental methodology for performing quasi-static tensile tests on common plastic items such as shopping bags using readily available equipment. The method employs dead-weight loading via known weights, simple mechanical grips, and manual strain measurement to obtain stress–strain behaviour, Young’s modulus (approximate) and yield strength. Results demonstrate that while absolute accuracy is lower than standardized ASTM or ISO methods, the approach provides reproducible trends suitable for educational purposes and comparative material analysis. Moreover, the glass transition (Tg) is illustrated by heating a polyethylene terephthalate (PET) sample under tensile load, changing its behaviour from glassy to rubbery when heated above its Tg. Finally, the elastocaloric effect in elastomers is discussed and illustrated by a simple experiment where a strip of rubber is quickly brought to the lips after being stretched and warmth is felt. These experiments allow for a tangible discovery of polymer properties, making the experience memorable.
2. Do-It-Yourself Tensile Test
Mechanical characterization of polymers is essential in materials science, product design, and sustainability studies. Tensile testing provides insight into elastic modulus, strength, ductility, and failure mechanisms. Standardized tensile testing (e.g., ISO 527 [1], ASTM D638 [2]) requires specialized equipment that may be inaccessible in home, classroom, or resource-limited settings. The objective of this work is to design and validate a simplified tensile testing experiment that can be conducted without a universal testing machine, using common household materials. The method is intended for educational use, preliminary material comparison, and sustainability-focused studies rather than high-precision certification testing.
In a tensile test a specimen is deformed until fracture, with a gradually increasing tensile load that is applied uniaxially along the long axis of the specimen. In this example we used a standardized tensile specimen, namely ASTM D638 type 2 specimen which is depicted in the Supplementary Information. This “dogbone” shape of the specimen assures that during testing, deformation is confined to the slender section and also to reduce the likelihood of fracture at the edges of the grips. Along the length of the slender section of the specimen the cross-section is uniform, therefore the engineering stress σ can be calculated according to:
$$\sigma = \frac{F}{A_0} = \frac{m \times a}{A_0}$$
The unit of engineering stress s is megapascals (MPa) or N/mm2. F is the instantaneous load applied perpendicular to the specimen cross-section, in units of newtons (N), and A0 is the original cross-sectional area before any load is applied (mm2). According to Newton’s Second Law (Force = mass x acceleration), we can calculate the applied forces from the known dead weights, assuming gravitational acceleration a of 9.81 m·s⁻².
The engineering strain is defined according to:
$$\varepsilon = \frac{L – L_0}{L_0} = \frac{\Delta L}{L_0}$$
In which L0 is the original length before any load is applied and L is the instantaneous length. Sometimes the quantity L − L0 is denoted as ΔL and is the deformation elongation or change in length at some instant, as referenced to the original length. Engineering strain is unitless, but millimetres per millimetre (mm/mm) is often used. Here, strain is expressed as a percentage, in which the strain value is multiplied by 100%.
Moreover, the tensile modulus E, more commonly known as stiffness, can be calculated using the following expression:
$$E = \frac{\sigma_2 – \sigma_1}{\varepsilon_2 – \varepsilon_1}$$
Where E is the tensile modulus of elasticity, in MPa, s1 is the stress measured at a deformation e1 and s2 is the stress measured at a deformation e2. According to ISO 527, typical values for e1 and e2 are 0.0005 mm/mm and 0.0025 mm/mm, respectively.
A schematic tensile stress-strain curve for a semicrystalline polymer is shown in Figure 1. It typically features an initial linear-elastic region, a non-linear yield point, followed by plastic deformation, necking, and eventual failure. Unlike metals, polymers often exhibit significant, time-dependent elongation and, depending on the polymer, may exhibit either ductile, brittle, or elastomeric behaviour. The key regions of the stress-strain curve for plastics are:
- Linear elastic region: The initial, straight portion where the plastic deforms elastically; if load is removed, the material returns to its original shape. The slope represents the Young’s modulus.
- Yield strength sy: The point where the curve deviates from linearity, indicating the onset of permanent, plastic deformation.
- Plastic deformation region: After yielding, the material undergoes molecular rearrangement. It may undergo cold drawing, where the plastic extends significantly at a roughly constant stress level.
- Ultimate tensile strength (UTS): The maximum stress the material can withstand.
- Necking and failure: The cross-sectional area decreases significantly (necking) before the material finally breaks at the fracture point.
![Figure 1. Schematic tensile stress¬-strain curve for a semicrystalline polymer. Specimen contours at several stages of deformation are included. Adopted from reference [3]](https://polymereducation.org/wp-content/uploads/2026/04/426_figure1-300x261.png)
Figure 1. Schematic tensile stress¬-strain curve for a semicrystalline polymer. Specimen contours at several stages of deformation are included. Adopted from reference [3]
- Brittle plastics such as polystyrene (PS) exhibit a high Young’s modulus (steep slope), high yield strength, but very low elongation, resulting in a sudden break.
- Ductile/tough plastics such as polyethylene have a comparably lower modulus, lower yield point, but high elongation, allowing significant deformation before breaking.
- Elastomers such as natural rubber show a very low initial modulus, low yield point, but extreme elasticity with a massive strain range before failure.
2.1 Experimental Setup
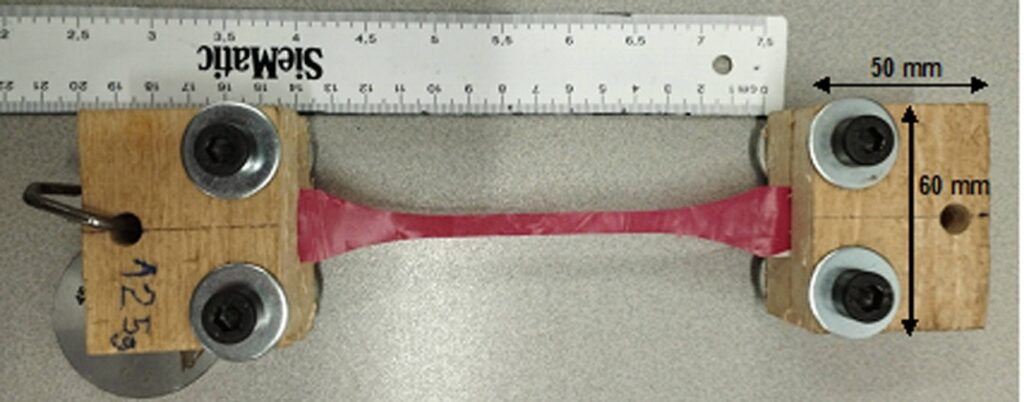
Our tensile testing setup consisted of a vertically mounted ASTM D638 type 2 specimen clamped at the top to a fixed grip (Figure 2). The specimens were cut from a shopping bag made from low density polyethylene (LDPE) and had a width of 6 mm and a thickness of 0.04 mm. Cuts were made in the Transverse Direction (TD), which runs horizontally across the width of the bag. All the details on how to prepare the specimens and to manufacture the grips can be found in the Supplementary Information. The bottom end of the specimen was attached to another grip connected to a hook used for dead-weight loading. The specimen was placed in such a way that the distance between grips was 135 mm. Then, the setup was fixed vertically and known weights were added incrementally to apply a gradually increasing tensile force. Elongation was measured manually between grips after each load increment using a ruler. At a tensile force of 2.7 N, corresponding to a yield strength around 11 N/mm2, the samples began to form a neck (Figure 2e) and localized plastic deformation occurred. Table 1 exemplarily shows the collected data of one such experiment.
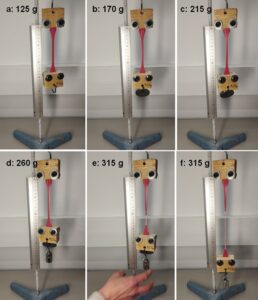
Figure 2. DIY tensile test setup with increasing weight applied to the lower grip.
Table 1. Experimental results of DIY tensile test 1.
| weight (g) | F (N) | ΔL (mm) | ε (%) | σ (N/mm²) |
|---|---|---|---|---|
| 0 | 0 | 0 | 0 | 0 |
| 125 | 1.3 | 3 | 2.2 | 5.3 |
| 170 | 1.7 | 6 | 4.4 | 7.2 |
| 215 | 2.2 | 8 | 5.9 | 9.1 |
| 260 | 2.7 | 13 | 9.6 | 11.0 |
The DIY tensile test was repeated three times and the individual stress and strain values were calculated. Then, the Young’s modulus E was determined using the second pair of stress and strain values (e.g. E = 5.3 N/mm2/0.024 = 221 N/mm2). Yield strength was determined from the stress applied at the moment when necking occurred; the results are summarized in Table 2.
Table 2. Results of yield strength and Young’s modulus calculated from three DIY tensile tests.
| Sample | σy (N/mm²) | E (N/mm²) |
|---|---|---|
| DIY 1 | 11.0 | 221 |
| DIY 2 | 11.5 | 358 |
| DIY 3 | 11.5 | 717 |
| Average | 11.3 | 432 |
| Stand. dev. | 0.2 | 256 |
In order to verify our DIY tensile test results, we also performed five tensile tests on the same specimens using a universal testing machine (model: ZwickRoell Z010 RetroLine equipped with a 10 kN load cell). The tests were conducted according to ISO 527, i.e. the modulus was determined at 1 mm/min in a strain range of 0.05% to 0.25% and then the test speed was increased to 100 mm/min; the results are shown in Table 3. Moreover, the stress-strain curves of the three DIY tensile tests as well as a representative sample tested with the universal testing machine are compared in Figure 3.
Table 3. Tensile properties determined with a universal testing machine.
| Sample | σy (N/mm²) | E (N/mm²) | σB (N/mm²) | εB (%) |
|---|---|---|---|---|
| 1 | 12.5 | 373 | 24.6 | 364 |
| 2 | 10.7 | 536 | 23.7 | 361 |
| 3 | 14.0 | 373 | 26.1 | 401 |
| 4 | 15.1 | 359 | 23.9 | 381 |
| 5 | 11.6 | 310 | 22.9 | 334 |
| Average | 12.8 | 390 | 24.2 | 368 |
| Stand. dev. | 1.8 | 86 | 1.2 | 25 |
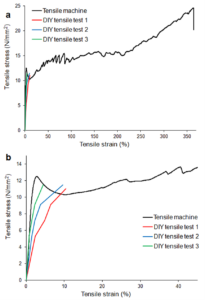
Figure 3. Stress-strain curves of the three DIY tensile tests and a representative sample tested with the universal testing machine. (a) whole strain range, (b) detail.
As can be seen in Figure 3, the three DIY tensile tests fit well to the results obtained with a universal testing machine for small elongations up to the yield point. Comparing the average yield strengths and tensile moduli obtained from both types of tensile test (see Tables 2 and 3), it is clear that while absolute accuracy is lower in our DIY tensile test than standardized ASTM or ISO methods, the approach provides reproducible trends suitable for educational purposes and comparative material analysis.
3. Glass Transition
The glass transition is the phenomenon by which an amorphous or semi-crystalline polymer changes from a rigid and brittle (glassy) state to a softer and more flexible (rubbery) state as the temperature increases [4]. This transformation occurs around a temperature called the glass transition temperature, Tg. This thermal property is essential for understanding the mechanisms of molecular relaxation, or the movement of atoms around equilibrium positions, that directly impact the mechanical behaviour of plastics under different conditions. Figure 4 shows a schematic of the glass transition principle in polymers. The spheres can represent atoms or groups of atoms (molecules) that have strong bonds between them (covalent bonds represented by the lines). The polymer is made up of several chains of these atoms or groups of atoms. The drawing represents two portions of two chains of a polymeric material. Below the glass transition temperature, the polymer is in a glassy state and has little molecular motion; above it, it is in a rubbery state and has high molecular motion. Depending on its class, a polymer can be found at room temperature in a glassy state (some plastics) or in a rubbery state (most elastomers).
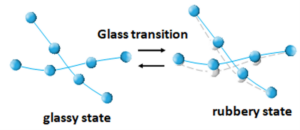
Figure 4. Schematic of the glass transition principle in polymers. In blue, the polymer chain segments at time t; in gray, the same polymer chain segments at another time due to molecular motion.
3.1 Experimental Setup
This demonstration consists of heating a PET sample under tensile load, changing its behaviour from glassy to rubbery when heated above its glass transition temperature. For this experiment you will need the tensile grips from the DIY tensile test and a tensile specimen extracted from a PET bottle; for details see the Supplementary Information at the end of this article. The Tg of bottle-grade PET is around 70 ºC and its yield strength at room temperature typically ranges from 40 MPa for unoriented PET up to over 100 MPa for biaxially oriented PET. However, mechanical properties are significantly different when PET is heated above its Tg, namely the stiffness and strength decrease while ductility increases.
In this experiment, we mounted a PET tensile specimen in our DIY grips, measured the initial cross-section of the specimen and calculated the necessary force (and hence weight) to create a tensile stress close to, but below the yield strength of PET, namely 35 N/mm2. We set up the DIY tensile test applying the corresponding weight (Figure 5a) and then heated the slender section of the specimen with a hair dryer (Figure 5b). When the PET specimen reached its glass transition temperature, it became rubbery and flexible, and as a consequence, necking and large plastic deformation occurred (Figure 5c).
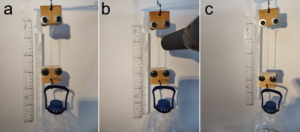
Figure 5. PET specimen heated above its glass transition temperature exhibiting necking under tensile load, changing its behaviour from rigid to rubbery. Figure 5a: PET sample before heating. Figure 5b: sample during heating, reaching its glass transition temperature. Figure 5c: elongation of the sample after heating.
4. Elastocaloric Effect
The elastocaloric effect consists of temperature variations induced by the deformation of certain elastomers, resulting from changes in their internal structure (Figure 6) [5]. The diagram illustrates how polymer chains heat up as deformation mechanisms occur: entropic elasticity generates an initial, smaller heating (thermoelastic effect), while crystallization under elastomer deformation generates a second, larger heating (latent heat of phase change). Using a portable thermal camera (HIKMICROVIEWER [6]), these changes can be visualized: increases exceeding 30 °C when the sample is rapidly stretched, and decreases of up to 13 °C upon release. According to the testimonies of spectators (general public, ages 15~65) during open campus days, real-time thermal visualization has a significant impact on participants, who intuitively grasp the link between molecular structure and the thermal properties of these polymer classes.
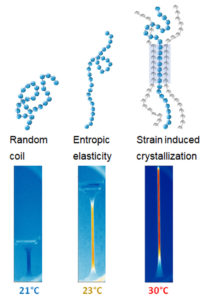
Figure 6. Schematic of elastomer polymer chains in various deformed states (undeformed on the left or highly deformed on the right). The rectangles represent infrared camera images illustrating the surface temperature of an elastomer sample in different deformation states (blue corresponds to room temperature of 21°C, yellow to 23°C, and red to 30°C).
4.1 Experimental Setup
Normally, secondary school laboratories are not equipped with portable thermal cameras. However, the elastocaloric effect can be felt when a rubber band is manually stretched and quickly placed on the lips (Figure 7), an area particularly sensitive to temperature. Heating is observed during stretching (exothermic process), and cooling is observed upon release of the sample (endothermic process). This effect could occur due to any type of dissipative mechanism in polymers (molecular friction or breaking of intramolecular bonds). However, when the same sample is relaxed and placed back on the lips, a cold sensation is felt, ruling out dissipative effects. This cold is due, among other things, to the melting of crystals formed during deformation. Crystallization, being an exothermic process, releases heat, while melting, being an endothermic process, cools the material through absorption of heat.

Figure 7. Experiencing the elastocaloric effect when a strip of rubber is quickly brought to the lips after being stretched and consequently warmth is felt.
5. CONCLUSIONS
We have presented three educational experiences that allow for the accessible and sensory introduction of key concepts in polymer science: basic mechanical properties such as the Young’s modulus and yield strength, the glass transition and the elastocaloric effect.
These activities have proven effective in capturing the interest of high school students and fostering the understanding of complex concepts through direct experience. Student reactions have been very positive, with surprise and enthusiasm being particularly evident when physically “feeling” the phenomena.
Looking ahead, work is underway to simplify the experiments, to eliminate the need for specialized laboratory equipment and to broaden the sensory range of the activities by integrating other stimuli such as sound and smell, making them even more accessible and adaptable to school settings.
- Abt 1,2,*, N. Candau 1,2
1eb-POLICOM – e-PLASCOM, Department of Materials Science and Engineering, Barcelona-Tech, Campus Diagonal Besòs-EEBE, Universitat Politècnica de Catalunya – Barcelona, 08019, Spain
2Center for Research in Multiscale Science and Engineering of Barcelona, Barcelona-Tech, Campus Diagonal Besòs-EEBE, Universitat Politècnica de Catalunya – Barcelona, 08019, Spain
*Corresponding author: tobias.abt@upc.edu
6. REFERENCES
[1] International Organization for Standardization. (2019). ISO 527-1:2019 Plastics — Determination of tensile properties — Part 1: General principles.
[2] ASTM D638-14, “Standard Test Method for Tensile Properties of Plastics,” ASTM International, West Conshohocken, PA, 2014.
[3] Callister, W. D., Jr., & Rethwisch, D. G. (2018). Materials science and engineering: An introduction (10th ed.). Wiley. p. 515, Figure 15.4.
[4] M. C. Shen and A. Eisenberg, ‘Glass transitions in polymers’, Progress in Solid State Chemistry, vol. 3, pp. 407–481, Jan. 1967, doi: 10.1016/0079-6786(67)90039-8.
[5] J. P. Joule, ‘V. On some thermo-dynamic properties of solids’, Philosophical Transactions of the Royal Society of London, vol. 149, pp. 91–131, Jan. 1997, doi: 10.1098/rstl.1859.0005.
[6] ‘HIKMICRO Viewer Software’. Accessed: Jun. 26, 2025. [Online]. Available: https://www.hikmicrotech.com/en/industrial-products/hikmicro-viewer-software/
Acknowledgments
This work is part of Maria de Maeztu Units of Excellence Programme CEX2023-001300-M funded by MCIN/AEI /10.13039/501100011033.
Supplementary Information
1. Required tools and materials
The following tools and materials are needed:
- Scissors or a utility knife
- Ruler for strain measurement
- Callipers
- Marker
- Kitchen or laboratory scale
- Different weights or a water bottle for loading
- Fixed support such as a door frame or a bar between two table edges
- Drilling machine with 8 mm wood drill bit
- 4x wooden board with dimensions of 60 x 50 x 15 mm
- 4x M8 bolts, 50 mm length with nuts and washers
- 2x steel hook
2. Sample preparation
You can print Figure 8 and use it as a template, or place your plastic film or sheet sample (e.g. shopping bag, packaging, etc.) directly on your PC screen and then trace the tensile specimen with a marker. Carefully cut out the specimen with scissors from your plastic sample. For a more accurate thickness measurement, you can either stack several specimens or fold the plastic bag in the same direction as the samples were extracted, until you get at least 10 layers. Then measure the thickness of the stacked specimens or film layers with a calliper and divide the result by the number of layers. Make sure that all specimens are either cut in the Transverse Direction (TD), which runs horizontally across the width of the bag, or in the Machine Direction (MD), which runs vertically along the length of the bag, from the handles down to the bottom seal. This is the direction the plastic film was extruded or blown during manufacturing and the mechanical properties are notably different.
3. Grip manufacture
We used four pieces of wooden board with dimensions of 60 x 50 x 15 mm, drilled two holes of 8 mm diameter at a distance of 15 mm from the edges of the long side and a third hole 15 mm from the opposite edge in each board. Then we used four M8 bolts of 50 mm length with nuts and washers, and clamped two wooden boards together to form a tensile grip, and finally introduced a steel hook in the third hole; see Figure 9.
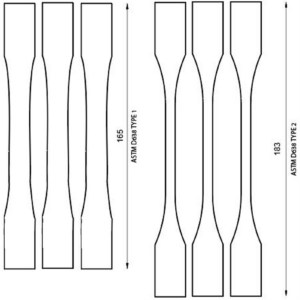
Figure 8. Templates of ASTM D638 type 1 and 2 specimen.

Figure 9. DIY tensile grips with mounted tensile specimen.
4. Loading Procedure
Loading was performed quasi-statically to reduce dynamic effects:
- Set zero-load gauge length (i.e. distance between grips L0) to the required value.
- Add weight in fixed mass increments (typically 50–100 g).
- After each increment, allow a dwell time of around 10 s to account for viscoelastic relaxation.
- Measure and record the elongation value.
- Continue loading until specimen yielding or failure occurs.
5. Limitations and Sources of Error
Key limitations include manual strain measurement accuracy, non-uniform specimen geometry, specimen surface defects due to cutting, viscoelastic creep during load holding, and premature specimen fracture at the edges of the grips due to sharp edges.